The PMS stars that appear as strong x-ray sources have masses < 1.5 solar masses, therefore let us look at our sun as a nearby example of a low mass x-ray emitting star. We will see two images of the sun which show the relationship between the solar magnetic field and the x-ray emission.
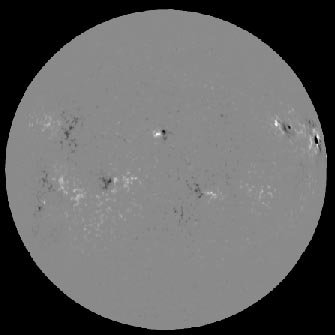
The first image is a magnetogram of the solar photosphere. The regions of highest contrast here are the locations where the magnetic field concentration is highest. Here the field lines have pushed through the solar photosphere and broken into the upper layers of the solar atmosphere forming loops in the chromosphere and corona of the sun. The light and dark areas show the regions of opposite polarity of the field where the flux tubes emerge from and return below the solar photosphere. Along these magnetic field lines hot gas (1-10 million °K) is confined and is the source of the x-ray emission seen in the second image.
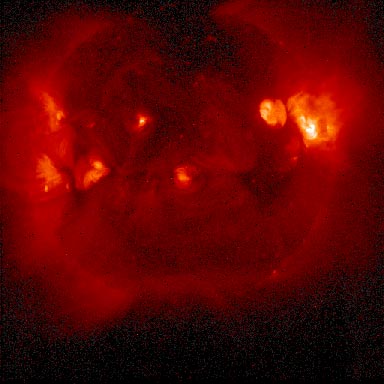
Because the magnetic field lines are free to expand in the upper atmospheres of these stars (the atmospheric pressure is much lower), the fraction of the solar disk (and even beyond the disk) where x-rays are emitted is considerably larger than the fraction occupied by sunspots. At sunspot maximum, the fraction of the solar disk covered by spots is 0.00015. Although the area covered by active regions is several times higher.
The presence of spots on PMS stars is inferred by the periodic variations in the brightness and the color of some of these stars (Vrba, Herbst & Booth 1988; Bouvier, Bertout & Bouchet 1988; Vrba et al. 1989). The spot coverage factors inferred from these studies can be > 0.10, much higher than the spot coverage on the Sun. For this reason alone the x-ray emission from PMS stars will be high. However, another factor contributes as well. The radii of these stars are larger than the solar radius -- by a factor of 2 - 3. This means that the surface area of the PMS stars are 4 - 9 times that of the Sun. The combination of these 2 factors leads to increases of 3000 - 3500 over the solar x-ray output (Strom et al. 1990)
The solar images shown here were taken from other Web servers. The x-ray image was taken by the Yohkoh Soft X-ray Telescope (SXT) on 26-Jan-94 at 17:05:39 and are supplied by the Hiraiso Central Research Laboratory in Japan.
The photospheric magnetogram is supplied by the U.S. National Solar Observatory on Kitt Peak in Arizona. This magnetogram was talen on 27-Jan-94 at 17:50:59.
The solar rotation period is 26.75 days. The rotation of the Sun due to the 1 day separation between these two images (14° ) is clearly seen in these 2 images.
You have probably also noted that some of the explanatory information that I used came from other servers, better able to give this information. The primary server used for this information is the Sacramento Peak Observatory which has an exhibit on the Sun available including a variety of images. The other server used is the National Solar Observatory in Tucson, AZ. On this server you can find an archive of solar magnetograms, mainly for professional astronomers, but with images of surrent and recent data available.
References
Bouvier, J., Bertout, C. & Bouchet,P. 1988, A & ApS, 75, 1.
Strom, K.M. et al. 1990, ApJ, 362, 168.
Vrba, F.J., Herbst, W. & Booth, J. 1988, AJ, 96, 1032.
Vrba, F.J., Rydgren, A.E., Chugainov, P.F., Shakovskaya, N.I., & Weaver, W.B. 1989, AJ, 97, 483.
www@hanksville.org
© 2000