![]()
![]()
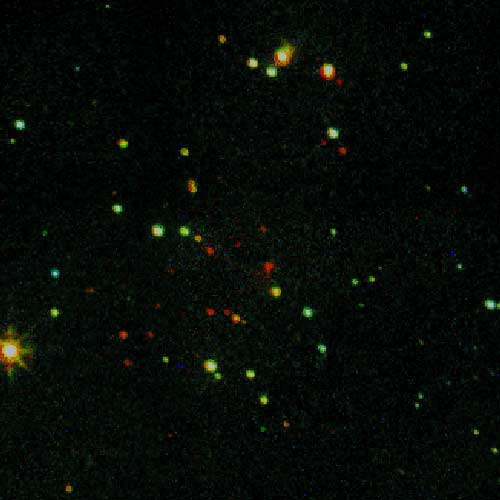
This is the near infrared image.
You may also see images at other wavelengths by clicking on the colorbar at a point above any of the dashed arrows (which point to other regions of the spectrum at which images are available). The solid arrow shows the spectral region you are seeing now. This is not intended to be a linear scale in wavelength, but only a rough guide to the wavelength of the observation.
This heavily embedded aggregate in the L1641 Center region is the location of a powerful molecular outflow (Fukui et al. 1986). This group was studied photometrically by Chen et al. (1993) and is extremely young as shown by the luminosity function (Strom, Strom & Merrill (1993). Many of the stars in this cluster suffer enormous extinctions (>30 magnitudes in the visible). Few are seen in visible light.
This near infrared pseudocolor image was made by combining the images at J (blue), H (green) and K (red). The shortest wavelength image is mapped into blue and the longest into red, producing the image that you see.
If you wish more information about these images, a page is available for your perusal. You may also return to the overview page.
References
Chen, H., Tokunaga, A.T., Strom, K.M. & Hodapp, K.-W. 1993, ApJ, 407, 639
Fukui,Y. et al. 1986, ApJ Letters, 311, L85
Strom, K.M., Strom, S.E. & Merrill, K.M. 1993, ApJ, 412, 233
www@hanksville.org © 1999-2000